




















Buffalo Bills at Minnesota Vikings
Final · ESPN

 23–6


At lock: projected BUF 21.00–20.00 MIN
How close was our sim?
The play-by-play sim is a separate engine from the computer pick; it can lean differently.
Pre-game sim locked Nov 8, 8:07 AM CT · 10,000 sims · seed 1413031608
- Winner: Bills (58%)
- Spread: MIN +3 covers (46% vs 46%, push 8%)
- Total: Over 43.5 (62%)
- Score error (both teams)17
| Player | Line | Sim median | Actual | Lean |
|---|---|---|---|---|
| A. Jones Sr. rush yds | — | 55 | 16 | off -39 |
| J. Jefferson rec yds | — | 55 | 58 | off 3 |
| J. Allen pass yds | — | 235 | 234 | off -1 |
| C. Wentz pass yds | — | 204 | 81 | off -123 |
| K. Shakir rec yds | — | 47 | 58 | off 11 |
| J. Cook III rush yds | — | 96 | 107 | off 11 |
| J. Addison rec yds | — | 41 | 28 | off -13 |
| D. Moore rec yds | — | 45 | 25 | off -20 |
Final from ESPN final. Sims are locked before start and never edited.
Advanced analytics
Matchup edge: BUF vs MIN
The model
How this number was built
BUF 21.00–20.00 MIN · Medium confidence
overline-model-v2: opponent-adjusted ratings + matchup features. Power index (FPI/BPI) plus shrunk attack/defense, blended with the posted market.
- Power indexMIN +2.7 vs BUF +5.8 · pred margin -2.7
- Opponent-adjusted ratings (model v2)EPA/play (opp-adj.) MIN off -0.17, def stop +0.14 · BUF off +0.12, def stop +0.06 · model MIN 19.5–21.7 BUF
- Home field+2.4 pts to MIN
- RecordMIN 6-2 · BUF 7-1
- Market priorBlended 67% toward BUF -3.5 / total 46.5
Line score
| Q1 | Q2 | Q3 | Q4 | T | |
|---|---|---|---|---|---|
| BUF | 3 | 7 | 3 | 10 | 23 |
| MIN | 0 | 6 | 0 | 0 | 6 |
How the points were scored
 FGQ1 1:573–0
Tyler Bass 39 Yd Field Goal
 FGQ2 4:023–3
Will Reichard 43 Yd Field Goal
- TDQ2 0:4410–3
Keleki Latu 25 Yd pass from Josh Allen (Tyler Bass Kick)
- FGQ2 0:0510–6
Will Reichard 53 Yd Field Goal
- FGQ3 6:0313–6
Tyler Bass 25 Yd Field Goal
- TDQ4 6:1720–6
James Cook III 5 Yd Rush (Tyler Bass Kick)
- FGQ4 4:4023–6
Tyler Bass 52 Yd Field Goal
Player stats
Full box — every player, every category.
Passing
| BUF | C/ATT | YDS | AVG | TD | INT | SACKS | QBR | RTG |
|---|---|---|---|---|---|---|---|---|
 Josh Allen #17 | 21/31 | 234 | 7.5 | 1 | 1 | 4-29 | 74.8 | 87.3 |
| Team | 21/31 | 205 | 7.5 | 1 | 1 | 4-29 | -- | 87.3 |
Rushing
| BUF | CAR | YDS | AVG | TD | LONG |
|---|---|---|---|---|---|
 James Cook III #4 | 31 | 107 | 3.5 | 1 | 11 |
Josh Allen #17 | 6 | 15 | 2.5 | 0 | 7 |
 DJ Moore #2 | 1 | 11 | 11.0 | 0 | 11 |
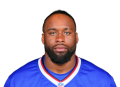 Ray Davis #7 | 2 | 2 | 1.0 | 0 | 2 |
 Ty Johnson #26 | 1 | 1 | 1.0 | 0 | 1 |
 Kyle Allen #11 | 3 | -2 | -0.7 | 0 | 0 |
| Team | 44 | 134 | 3.0 | 1 | 11 |
Receiving
| BUF | REC | YDS | AVG | TD | LONG | TGTS |
|---|---|---|---|---|---|---|
 Khalil Shakir #10 | 4 | 58 | 14.5 | 0 | 22 | 4 |
 Dawson Knox #88 | 4 | 37 | 9.3 | 0 | 12 | 5 |
Ty Johnson #26 | 2 | 36 | 18.0 | 0 | 36 | 2 |
 Dalton Kincaid #86 | 3 | 28 | 9.3 | 0 | 12 | 3 |
 Keleki Latu #83 | 1 | 25 | 25.0 | 1 | 25 | 1 |
DJ Moore #2 | 3 | 25 | 8.3 | 0 | 15 | 5 |
 Keon Coleman #0 | 3 | 17 | 5.7 | 0 | 11 | 6 |
 Jackson Hawes #85 | 1 | 8 | 8.0 | 0 | 8 | 1 |
James Cook III #4 | 0 | 0 | 0.0 | 0 | 0 | 1 |
Ray Davis #7 | 0 | 0 | 0.0 | 0 | 0 | 1 |
| Team | 21 | 234 | 11.1 | 1 | 36 | 29 |
Fumbles
| BUF | FUM | LOST | REC |
|---|---|---|---|
 Greg Rousseau #15 | 0 | 0 | 1 |
| Team | 0 | 0 | 1 |
Defense
| BUF | TOT | SOLO | SACKS | TFL | PD | QB HTS | TD |
|---|---|---|---|---|---|---|---|
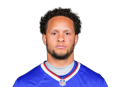 Terrel Bernard #8 | 6 | 2 | 0 | 0 | 2 | 1 | 0 |
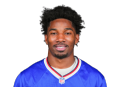 Dee Alford #23 | 4 | 3 | 0 | 0 | 0 | 0 | 0 |
 Cole Bishop #24 | 4 | 3 | 0 | 0 | 0 | 0 | 0 |
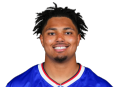 TJ Parker #99 | 3 | 1 | 0 | 0 | 0 | 0 | 0 |
 Dorian Williams #42 | 3 | 0 | 0 | 0 | 1 | 0 | 0 |
 Damar Hamlin #3 | 2 | 2 | 0 | 0 | 0 | 0 | 0 |
 Christian Benford #47 | 2 | 2 | 0 | 0 | 1 | 0 | 0 |
 Te'Cory Couch #33 | 2 | 2 | 0 | 0 | 0 | 0 | 0 |
 Kaleb Elarms-Orr #52 | 2 | 2 | 0 | 0 | 0 | 0 | 0 |
 Ed Oliver #91 | 2 | 1 | 0 | 0 | 0 | 3 | 0 |
Greg Rousseau #15 | 1 | 1 | 1 | 1 | 1 | 3 | 0 |
 Javon Solomon #56 | 1 | 1 | 1 | 1 | 0 | 1 | 0 |
 Michael Hoecht #55 | 1 | 1 | 0 | 0 | 0 | 0 | 0 |
 Tylan Grable #68 | 1 | 1 | 0 | 0 | 0 | 0 | 0 |
 DeWayne Carter #90 | 1 | 1 | 0 | 0 | 0 | 0 | 0 |
 Tommy Doman Jr. #39 | 1 | 1 | 0 | 0 | 0 | 0 | 0 |
Keleki Latu #83 | 1 | 1 | 0 | 0 | 0 | 0 | 0 |
 Maxwell Hairston #1 | 1 | 1 | 0 | 0 | 0 | 0 | 0 |
 Bradley Chubb #9 | 1 | 0 | 0 | 0 | 1 | 0 | 0 |
 T.J. Sanders #98 | 1 | 0 | 0 | 0 | 0 | 1 | 0 |
 Deone Walker #96 | 1 | 0 | 0 | 0 | 0 | 0 | 0 |
 Davison Igbinosun #21 | 1 | 0 | 0 | 0 | 1 | 0 | 0 |
| Team | 42 | 26 | 2 | 2 | 7 | 9 | 0 |
Interceptions
| BUF | INT | YDS | TD |
|---|---|---|---|
Terrel Bernard #8 | 1 | 5 | 0 |
Dorian Williams #42 | 1 | 0 | 0 |
| Team | 2 | 5 | 0 |
Kick returns
| BUF | NO | YDS | AVG | LONG | TD |
|---|---|---|---|---|---|
 Greg Dortch #19 | 1 | 58 | 58.0 | 58 | 0 |
| Team | 1 | 58 | 58.0 | 58 | 0 |
Punt returns
| BUF | NO | YDS | AVG | LONG | TD |
|---|---|---|---|---|---|
Greg Dortch #19 | 2 | 11 | 5.5 | 6 | 0 |
| Team | 2 | 11 | 5.5 | 6 | 0 |
Kicking
| BUF | FG | PCT | LONG | XP | PTS |
|---|---|---|---|---|---|
 Tyler Bass #16 | 3/3 | 100.0 | 52 | 2/2 | 11 |
| Team | 3/3 | 100.0 | 52 | 2/2 | 11 |
Punting
| BUF | NO | YDS | AVG | TB | In 20 | LONG |
|---|---|---|---|---|---|---|
Tommy Doman Jr. #39 | 5 | 228 | 45.6 | 2 | 0 | 48 |
| Team | 5 | 228 | 45.6 | 2 | 0 | 48 |
Team stats
Every official team number from this game. The better side is highlighted.
| BUF | MIN | |
|---|---|---|
| 1st Downs | 22 | 9 |
| Passing 1st downs | 14 | 6 |
| Rushing 1st downs | 8 | 1 |
| 1st downs from penalties | 0 | 2 |
| 3rd down efficiency | 7-18 | 0-8 |
| 4th down efficiency | 1-1 | 0-2 |
| Total Plays | 79 | 46 |
| Total Yards | 339 | 178 |
| Yards per Play | 4.3 | 3.9 |
| Total Drives | 13 | 12 |
| Passing | 205 | 127 |
| Comp/Att | 21/31 | 14/32 |
| Yards per pass | 5.9 | 3.7 |
| Interceptions thrown | 1 | 2 |
| Sacks-Yards Lost | 4-29 | 2-12 |
| Rushing | 134 | 51 |
| Rushing Attempts | 44 | 12 |
| Yards per rush | 3.0 | 4.3 |
| Red Zone (Made-Att) | 1-3 | 0-1 |
| Penalties | 8-62 | 4-20 |
| Turnovers | 1 | 3 |
| Fumbles lost | 0 | 1 |
| Defensive / Special Teams TDs | 0 | 0 |
| Possession | 42:32 | 17:28 |
Grok Expert vs the model
Two separate picks, each graded on its own record.
They agree: the model projects BUF by 1.00, which also covers MIN +3.
Why Grok Expert likes MIN +3: Home dog getting the full field goal at plus money. Minnesota is 6-1 and has allowed 16 or fewer points in four of its last five; Carson Wentz already helped win two games this year with Kyler Murray out. Buffalo is without WR Joshua Palmer and LT Dion Dawkins is questionable.
At lock BUF 21.00–20.00 MIN · BUF by 1.0 pts vs MIN +3 · 55% is the confidence saved at lock
MissProp Aaron Jones Sr. · MIN
16 YDS · needs 17.5 moreJosh Allen · BUF
21/31 C/ATT · 234 YDSCarson Wentz · MIN
8/25 C/ATT · 81 YDSJames Cook III · BUF
31 CAR · 107 YDSJordan Mason · MIN
6 CAR · 35 YDSKhalil Shakir · BUF
4 REC · 58 YDS
Data-Driven Pick · A. Jones Sr. Over 33.5 rush yds
Player props
The DraftKings line is the starting point. A prop moves off it only with a real player rate, and only at -120 or longer.
DraftKings hasn’t posted player props for this matchup yet.
Bills vs Vikings pick result · Nov 9, 2026
The OVERLINE computer pick is MIN +3, with a 55% model probability — it lost. Lines are DraftKings prices; picks lock at the start of the game and are graded off the official final.
More: NFL picks today · Graded record · Play of the Day